Debugger
The debugger is a built-in tool that manipulates the Nintendo 64.
It can be invoked by launching the emulator with the --debug (or -d) argument, or at any time by hitting the Pause/Break key.
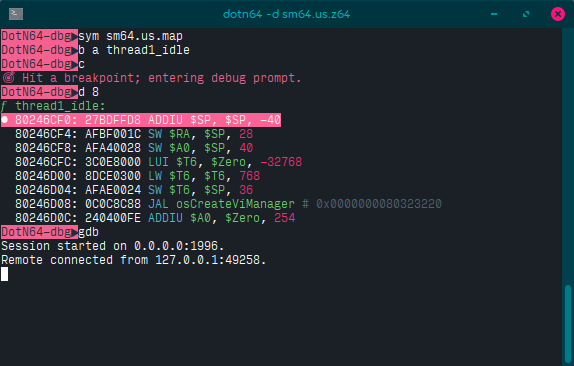
Preview
Commands
| Name | Arguments | Description |
|---|---|---|
continue, c |
until (optional) |
Continues execution of the CPU. |
step, s |
mode (optional), count (optional) |
Steps the CPU a specified amount of times. |
goto, g |
address or label |
Sets the CPU's PC to the specified address. |
disassemble, d |
count (optional) |
Disassembles instructions from the current PC. |
label, l |
action (optional) |
Shows, adds, or removes a label attached to an address. |
breakpoint, b |
action (optional) |
Shows, adds, or removes breakpoints. |
exit, quit, q |
None. | Exits the debugger. |
help, h, ? |
command (optional) |
Shows help for commands. |
clear |
None. | Clears the terminal. |
read, r |
address |
Reads a word from the SysAD bus. |
write, w |
address, data |
Writes a word into the SysAD bus. |
target, t |
cpu |
Switches the target CPU the debugger operates on (VR4300 or RSP). |
gdb |
port (optional) |
Starts a GDB session. |
symbol, sym |
file |
Loads labels from a symbol map file. |
macro |
action (optional) |
Records and replays a series of commands. |
continue
until(optional): Specifies the conditions under which the debugger will break.none: Will never stop execution.exception: Stops when an exception occurs.breakpoint: Stops when a breakpoint is reached.watchpoint: Stops when a bus access triggers a watchpoint.all: Includes all of the above (exceptnone).
Example
continueis equivalent tocontinue until all.continue until nonekeeps running the emulator even if exceptions are thrown.continue until watchpointonly stops on watchpoints.
step
mode(default:cycle): The kind of stepping performed.cycle: Runs for a cycle (can follow exceptions/interrupts).in: Steps into the next instruction.out: Steps out of a function (until aJR $RAis found).over: Steps over function calls (JAL/JALRoperations).
count(default:1): Number of steps to perform.
Example
stepmaps tostep cycle 1, or a single cycle.step overmaps tostep over 1, or a single step over an instruction/function.step out 5leaves 5 consecutive functions.
goto
addressorlabel: Virtual address or label to jump to.
disassemble
count(default:1): Number of instructions to disassemble.
label
action(default:show): The action to perform.add,a: Adds a label.name: Name of the label.address(default:PC): Virtual address.
remove,r: Removes a label.address(default:PC): Virtual address.
clear,c: Clears all labels.show,s: Shows the list of active labels.
Example
label add Checkpointadds the label "Checkpoint" to the current PC.label add ResetVector BFC00000adds the label "ResetVector" at virtual address0xBFC00000.
breakpoint
action(default:show): The action to perform.add,a: Adds a breakpoint.address(default:PC): Virtual address.
remove,r: Removes a breakpoint.address(default:PC): Virtual address.
clear,c: Clears all breakpoints.show,s: Shows the list of active breakpoints.
gdb
port(default:1996): Which TCP port the debugger should listen on.
This command allows for remotely controlling the Nintendo 64 using GDB.
It has the advantage of providing source level debugging if an ELF file is loaded.
After running this command, start GDB on a new terminal:
gdb-multiarch -ex "set arch mips:4300" -ex "set endian big" <rom.elf>
In the (gdb) prompt, you can then connect using either:
-
target remote :1996if running the emulator locally with the default port, or -
target remote <address>:<port>for controlling a remote emulator.
macro
action(default:list)record: Records subsequent commands up until amacro savecommand gets issued.save: Saves the command list to a file.name: Name of the macro.
play: Replays the series of commands from the specified file.name: Name of the macro.
list: Lists the macros present in the current directory.
Disassembler
Columns
| Breakpoint | Virtual address | Instruction | OpCode | Operands |
|---|---|---|---|---|
● |
FFFFFFFFBFC00000: |
3408C350 |
ORI |
$T0, $Zero, -15536 |
Breakpoint
When shown, the debugger will halt on this instruction before it gets executed (only if you continue; stepping will not be interfered).
Virtual address
The location of the instruction.
Instruction
The hexadecimal representation of the instruction.
OpCode
The operation associated with the instruction.
Note
Coprocessor instructions have their unit number prepended to easily distinguish specialised operations (e.g. COP0.MT instead of MTC0).
Operands
A comma-separated list of values used by the instruction.
Registers are prefixed with a $, and their hexadecimal contents are only displayed when stepping.